Tips and Tricks for Student Data Reports
Having student data ready at your fingertips is becoming essential for every teacher in the classroom.
Maybe you already know that Gradient empowers you to quickly and easily create, score, and record assessments. You can create your own custom assessments – choosing from multiple question types – print on plain paper and then scan on any device. The result is instant feedback and actionable data.
What you may not know is that Gradient works really hard to make sure that data is organized in a way that’s most useful to you, the teacher. Because what’s the use of collecting all that valuable data if you can’t interpret it quickly?
Here are a few tips to use when viewing your student data reports in Gradient:
1. SORT DATA
Change the order in which the data is viewed using column headers.
The column headers in each report can be selected to sort the report on that field in ascending or descending order.
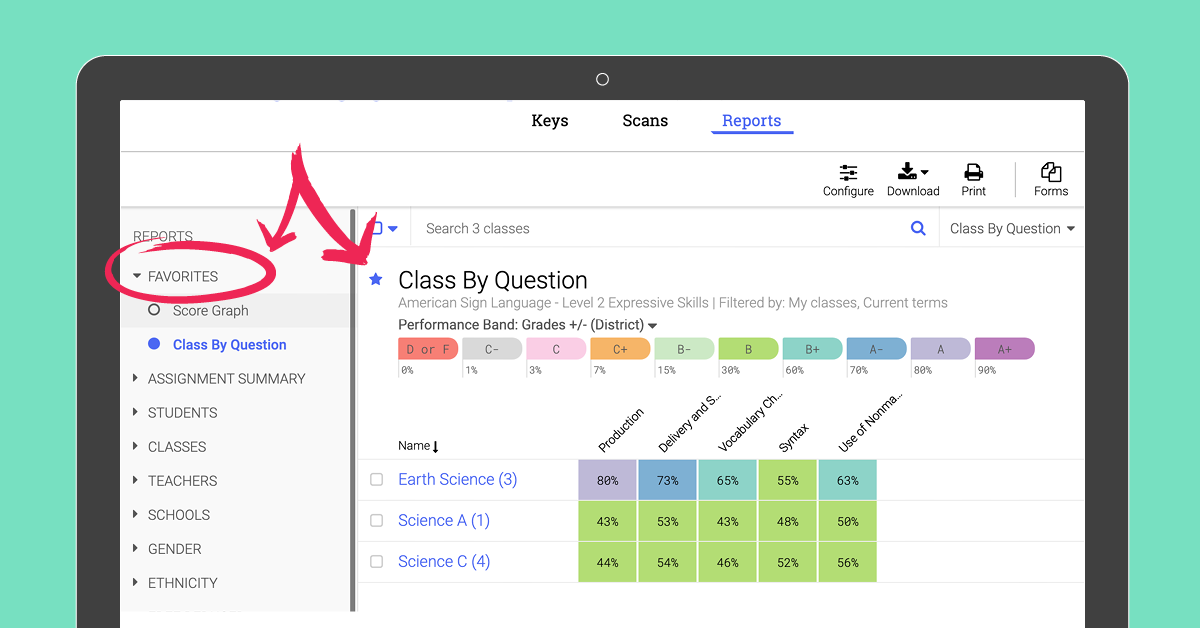
2. FAVORITE REPORTS
Create a “Favorites” category for quick access to your most-used reports.
First, select the “Reports” tab and locate one of your favorite reports. Then, select the star next to the report name.
A “Favorites” category will be added including each starred report.
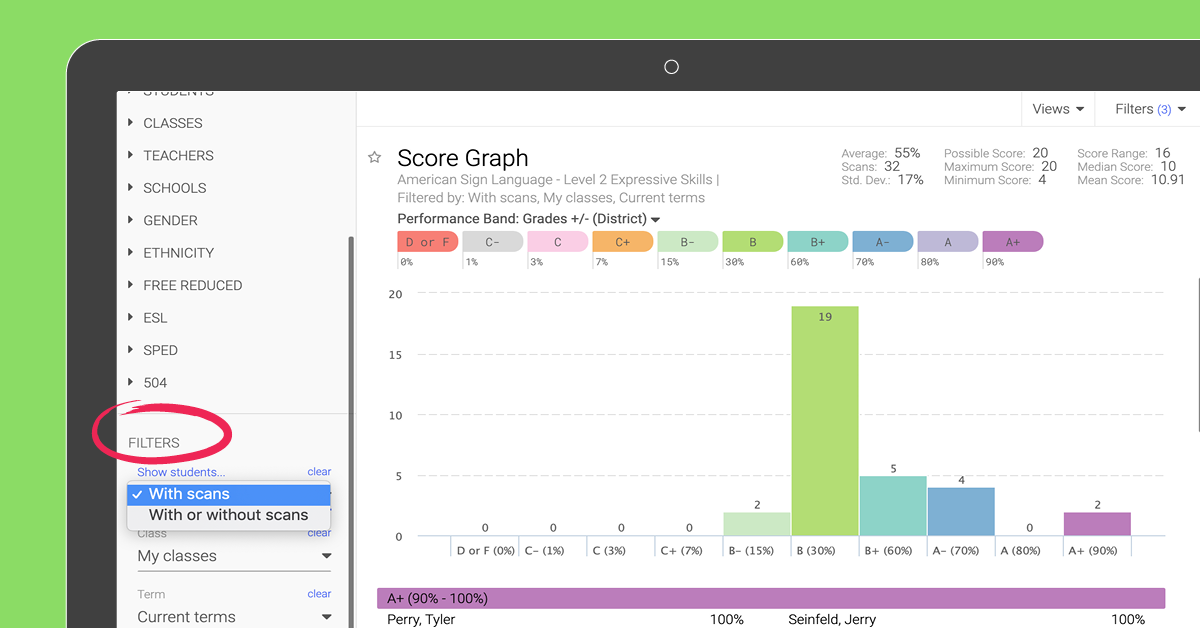
3. FILTER REPORTS LIST
Navigate to the desired report and select a filter from any section.
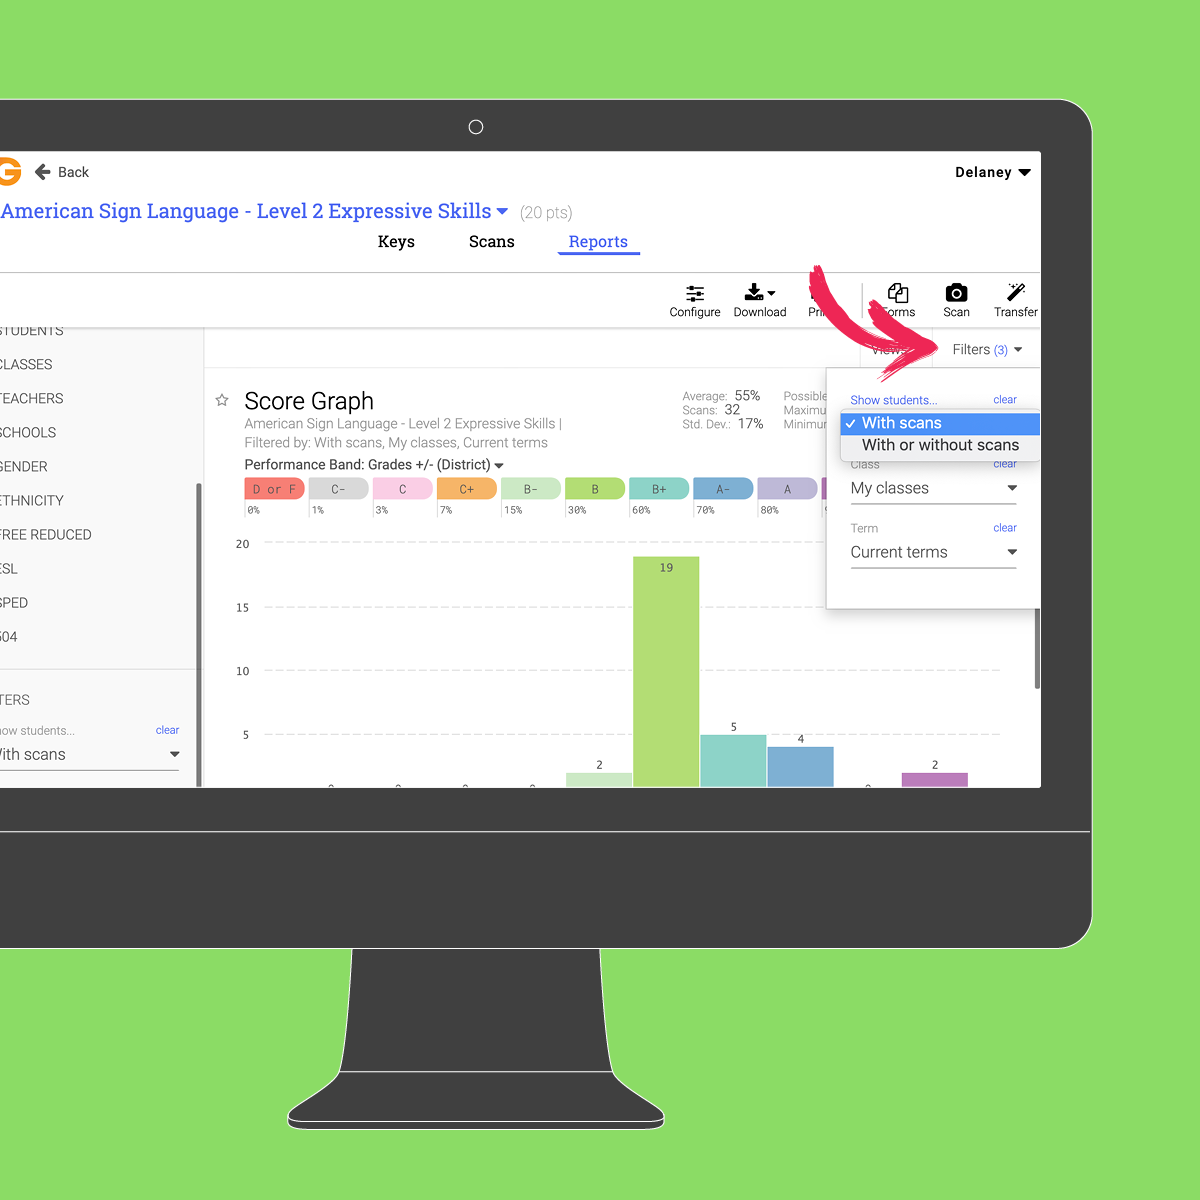
The report list will be limited by the filter selected.


Request Demo
